Practical guide
AI Infographic Concepts: Use the Model for Metaphor, Not Facts or Final Labels
Use image generation for visual systems, metaphors, and layout territories while keeping facts, numbers, charts, and labels verified and editable.
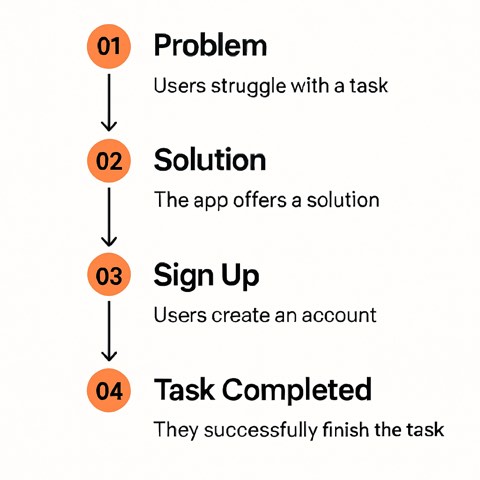
The central idea
An image model can inspire a visual language, but it should not generate factual charts or final labels. Separate research and information architecture from visual exploration, then rebuild the approved direction using verified data and accessible type.
A repeatable workflow
Verify the information
Finish sources, calculations, units, definitions, comparison basis, and narrative before exploring visual style.
Create the structure
Plan hierarchy, sequence, chart types, annotations, and reading order without an image model.
Explore visual systems
Generate metaphor, illustration, material, palette, and modular-layout territories using placeholder information.
Rebuild and audit
Create real charts and labels, cite sources, test contrast and screen-reader alternatives, and verify every value.
Worked example
For an energy-flow explainer, generation can explore pipe, river, circuit, and layered-city metaphors. The quantities, arrows, labels, categories, and source note must be constructed from verified information in a charting or design tool.
Review checklist
- Facts are complete before styling
- Information architecture is independent
- Generated content is only a concept
- Final data and labels are verified
Limitations
- Generated charts and labels are not data
- Complex graphics require accessible text alternatives